Grades 3 to 8 · Colorado

A complete engineering laboratory, delivered to your school.

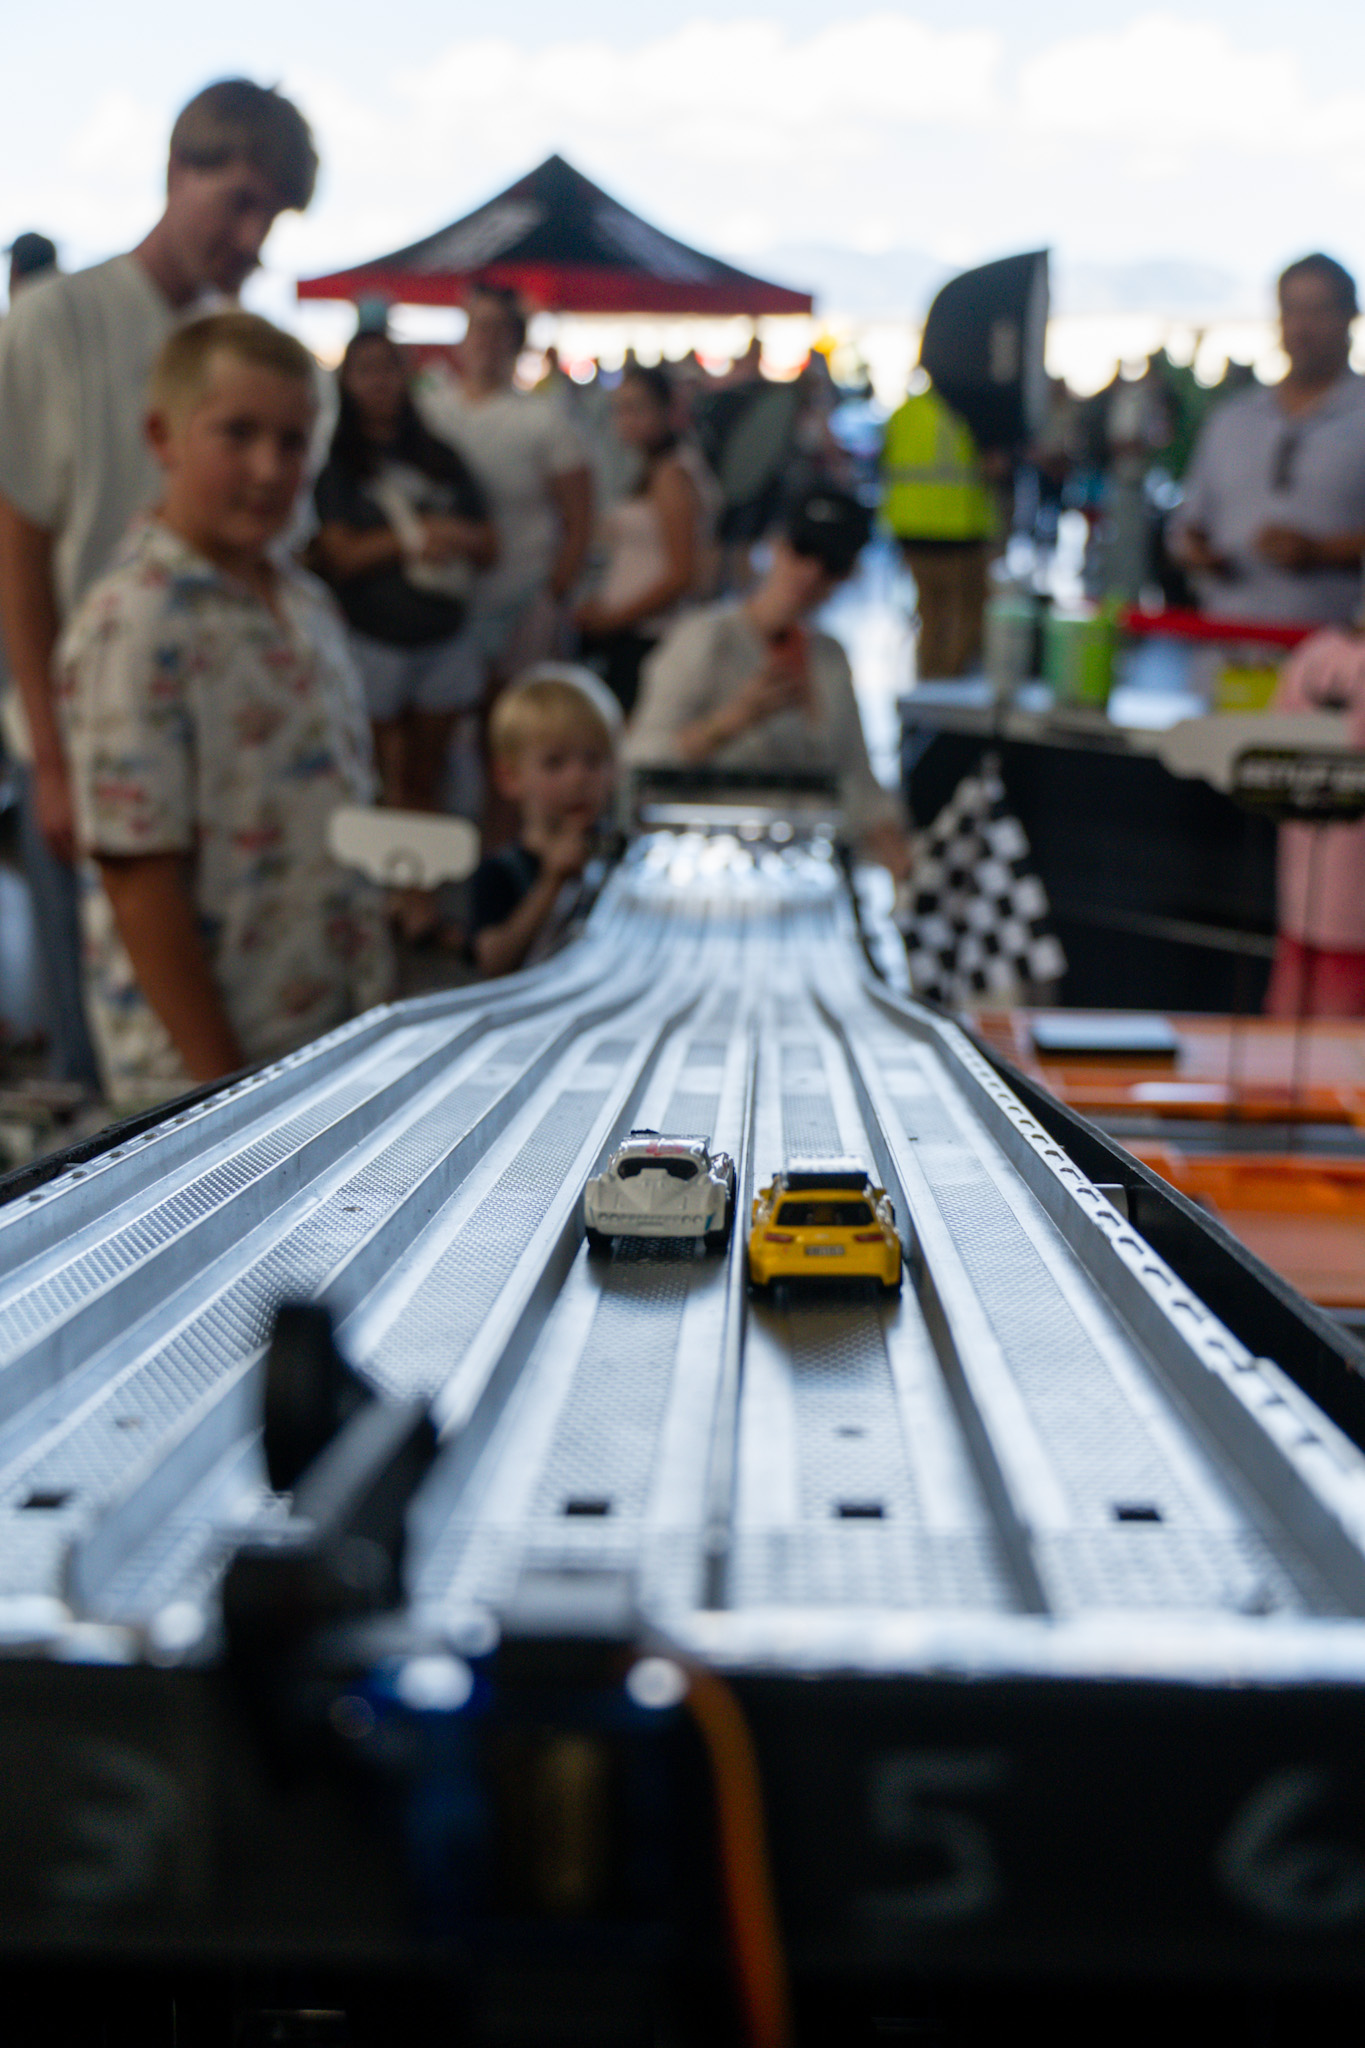
Hundreds of diecast vehicles, staffed tuning bays, and a six lane test track with calibrated sensor timing measured to 0.001 seconds. Students set a baseline, modify their vehicle, and retest to beat it. Every student keeps the vehicle they built.

Grades 3 to 8
Elementary and middle
NGSS & CAS
Aligned by grade
8 to 10
Trials per student
1 class
Per hour (~20 students)
Turnkey
Track, tools, staff provided
One session, one fifth grader

She was certain more mass meant more speed. Her own data said otherwise.

A fifth grader loaded her 1972 purple VW bus as heavy as the rules allowed for her ninth trial of the day. She felt certain the additional mass would carry her to a faster time. Eight trials of engineering had already cut fourteen percent off her 1.978 second baseline. This one came back ten percent slower than her best. She went backwards.

One trial left, and fifteen percent written on her card.

She is not nervous. Her chart shows every change she has made and what it did, and the correlation is clear: past a point, more mass stops buying speed. She returns to her work station and peels off two weights, four staying on, right where she wants them. The last percent has to come from the body, so the VW gets putty along the nose and a fresh dose of graphite on the axles before it is carried back to the scale for the last test.

All six lanes are occupied and the heat is locked. The lights count down and the cars release. It is all over in two seconds. Among the sounds of laughter and crashing vehicles at the bottom of the ramp, she stands in silence, watching for her number.

1.674 seconds. Fifteen point four percent. Her hypothesis is supported.

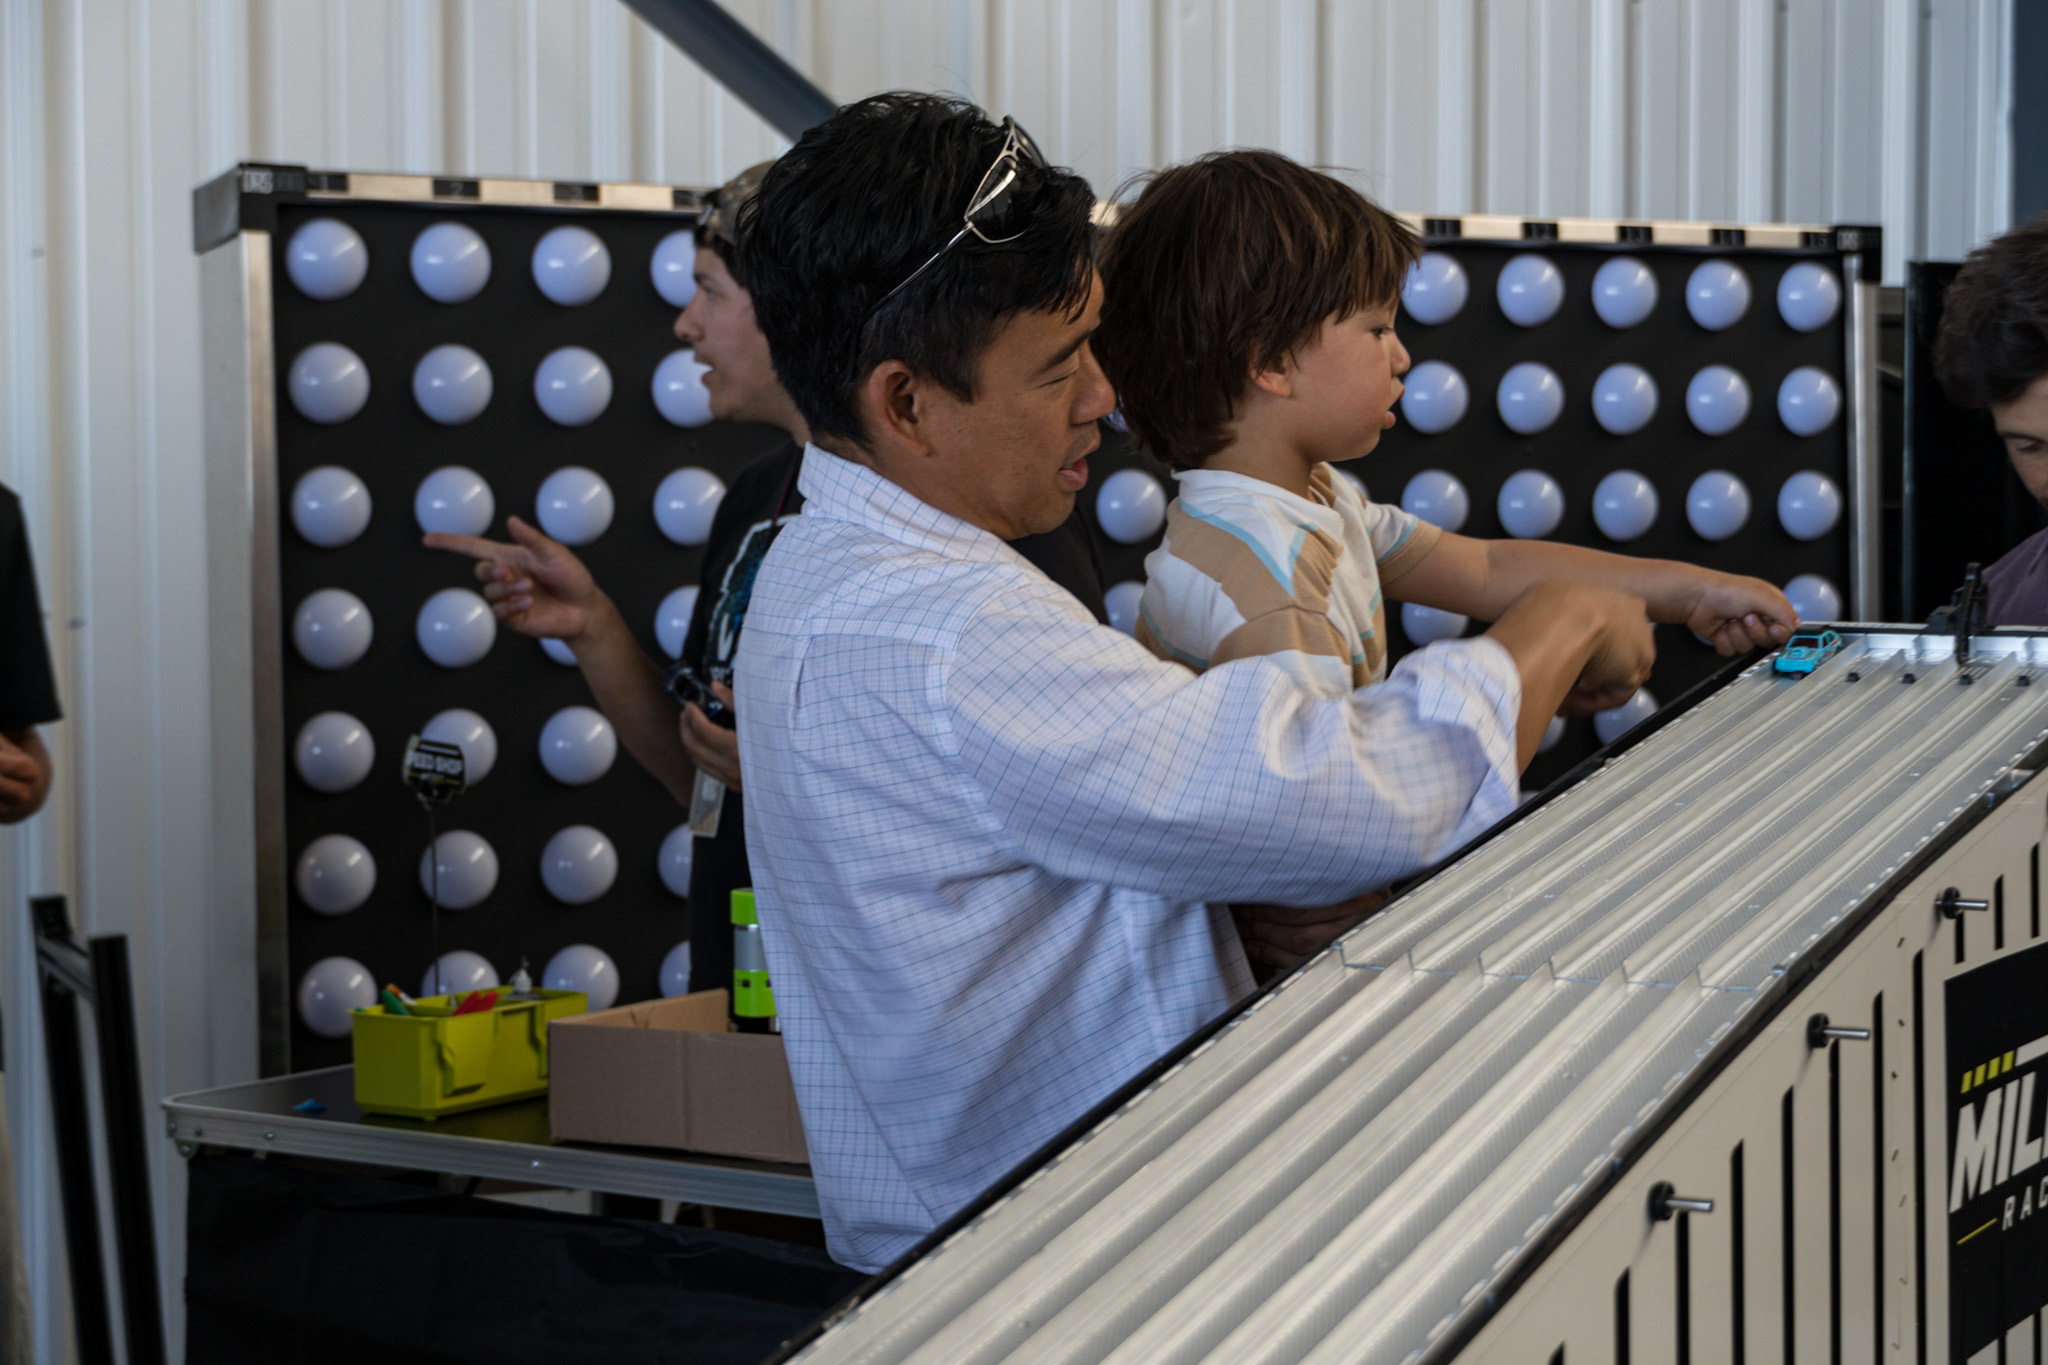
Six lanes of the test track with vehicles mid-run

That is the difference between an activity and an investigation. Scoring rewards the largest gain over a student's own baseline, so the student who starts slowest still has everything to play for.

The method

The engineering design cycle, the whole loop: baseline, change, retest.

01

Baseline

Record a first run. All gains are measured from it, so every student is competing against the only benchmark that is truly theirs.

02

Hypothesize

Predict how one change, and only one, affects time. The prediction is written down before the vehicle moves, which is what makes the next run an experiment.

03

Modify

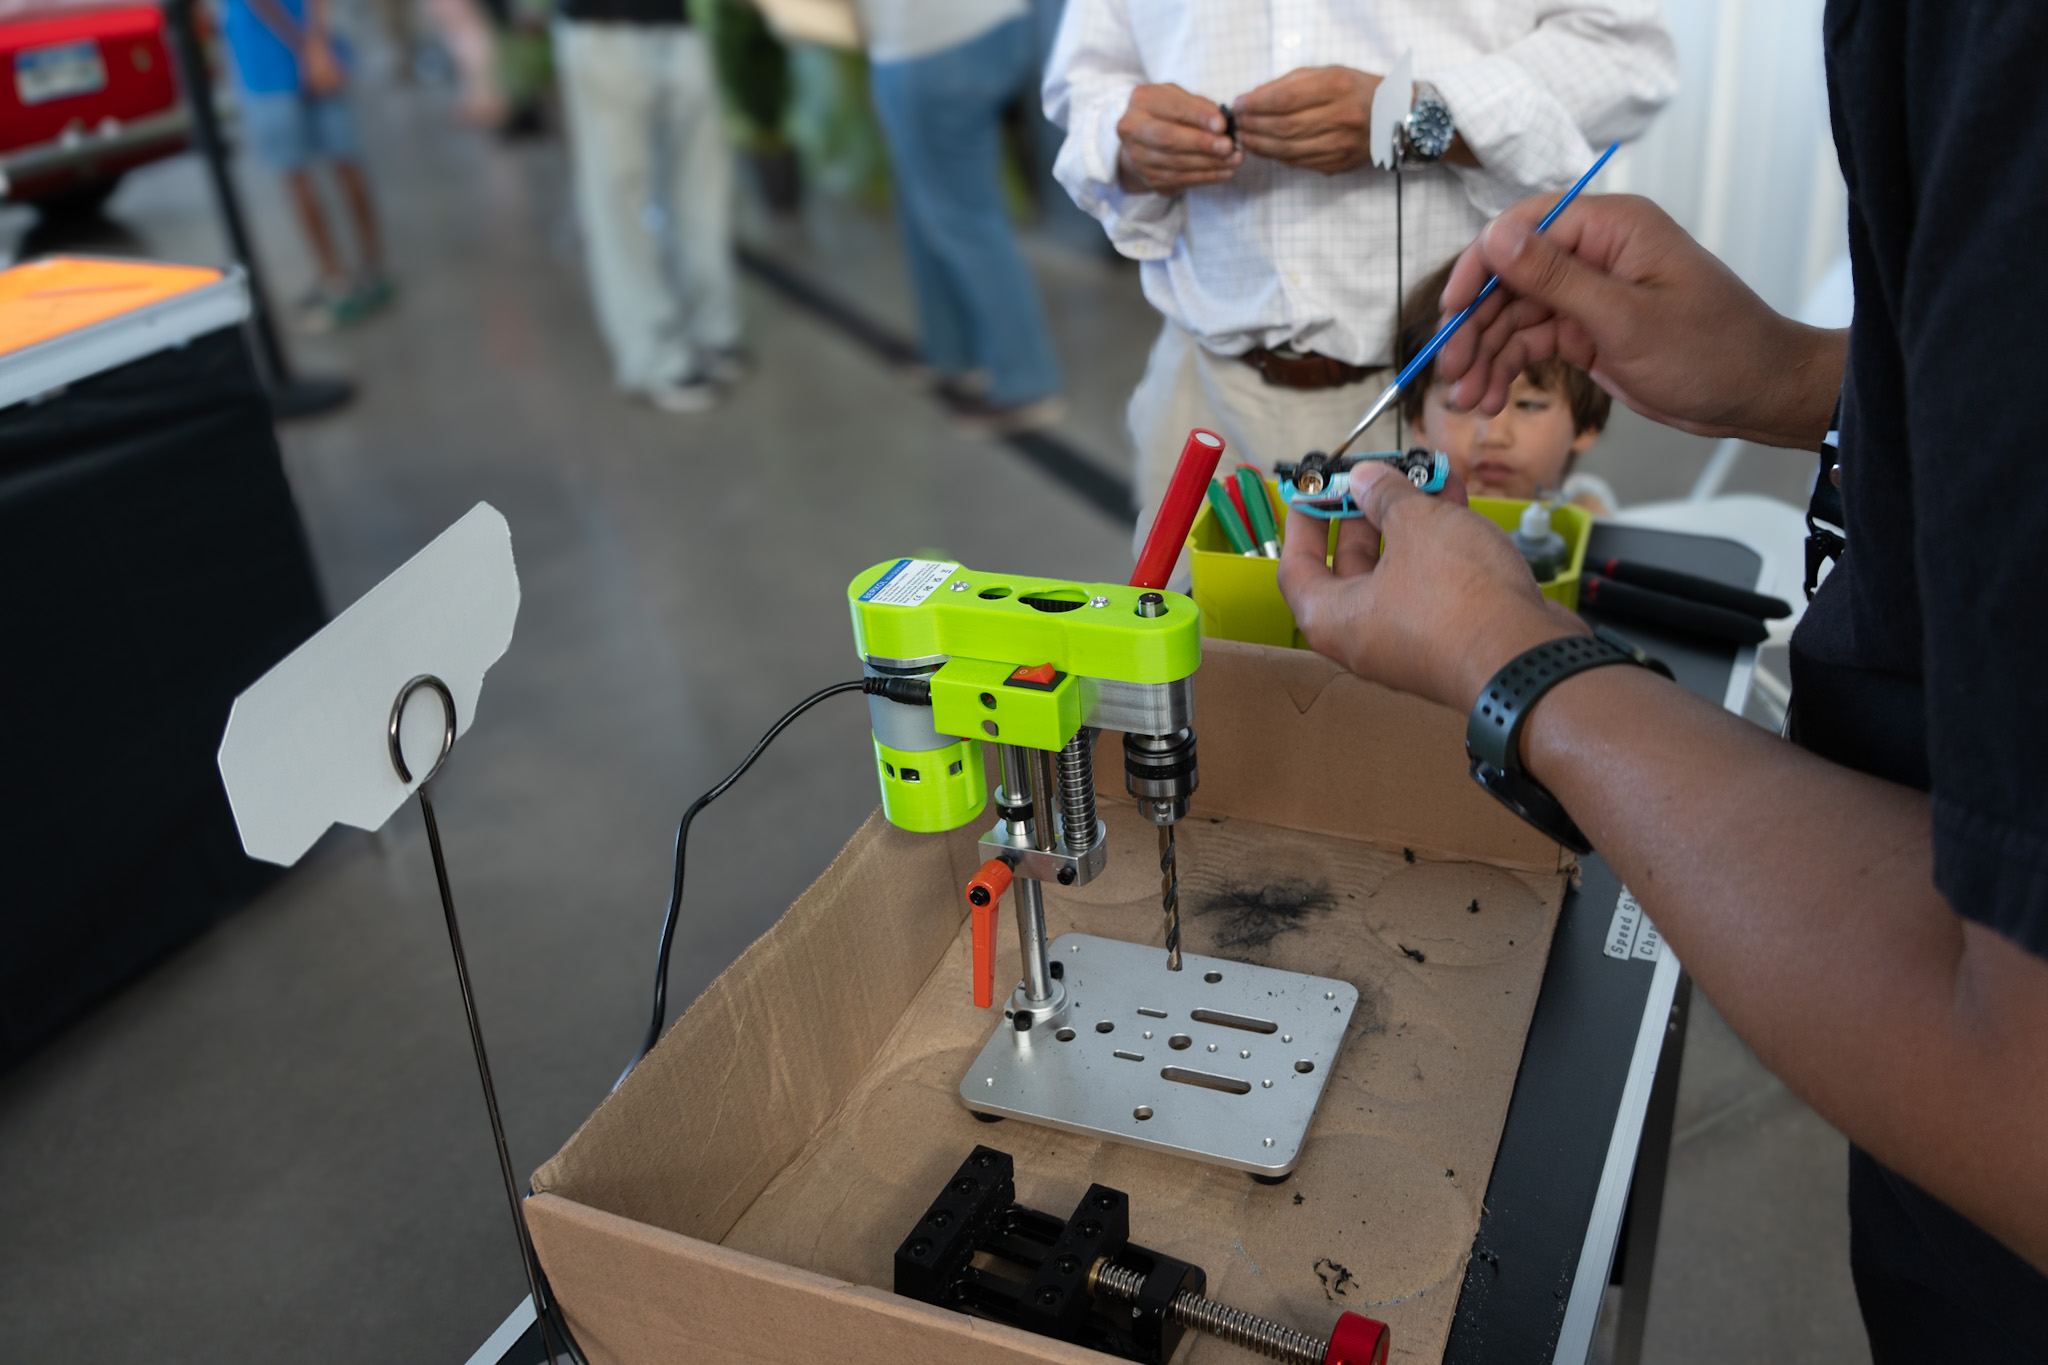
Adjust mass, reduce kinetic friction at the axles, modify the aerodynamic profile. Weights, putty, and a graphite station are staffed at every bay.

04

Verify

Weighed and inspected against spec before every run. Nothing races unmeasured, so no result is ever in dispute.

05

Quantify

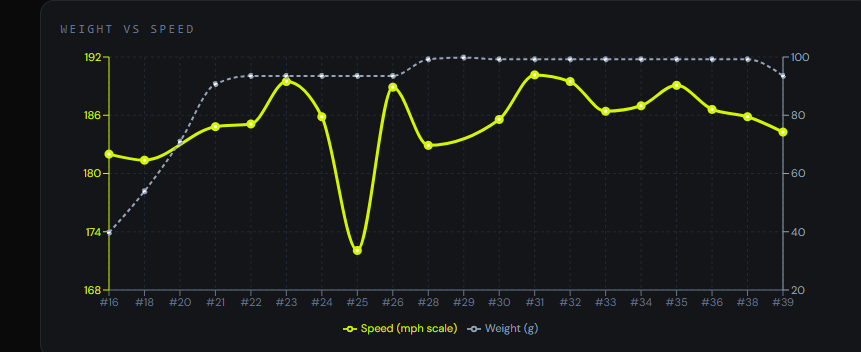
MilliOS, our software, logs every weigh-in and charts every trial. Students leave with the chart, printed or digital, and it is a science notebook they did not have to be told to keep.

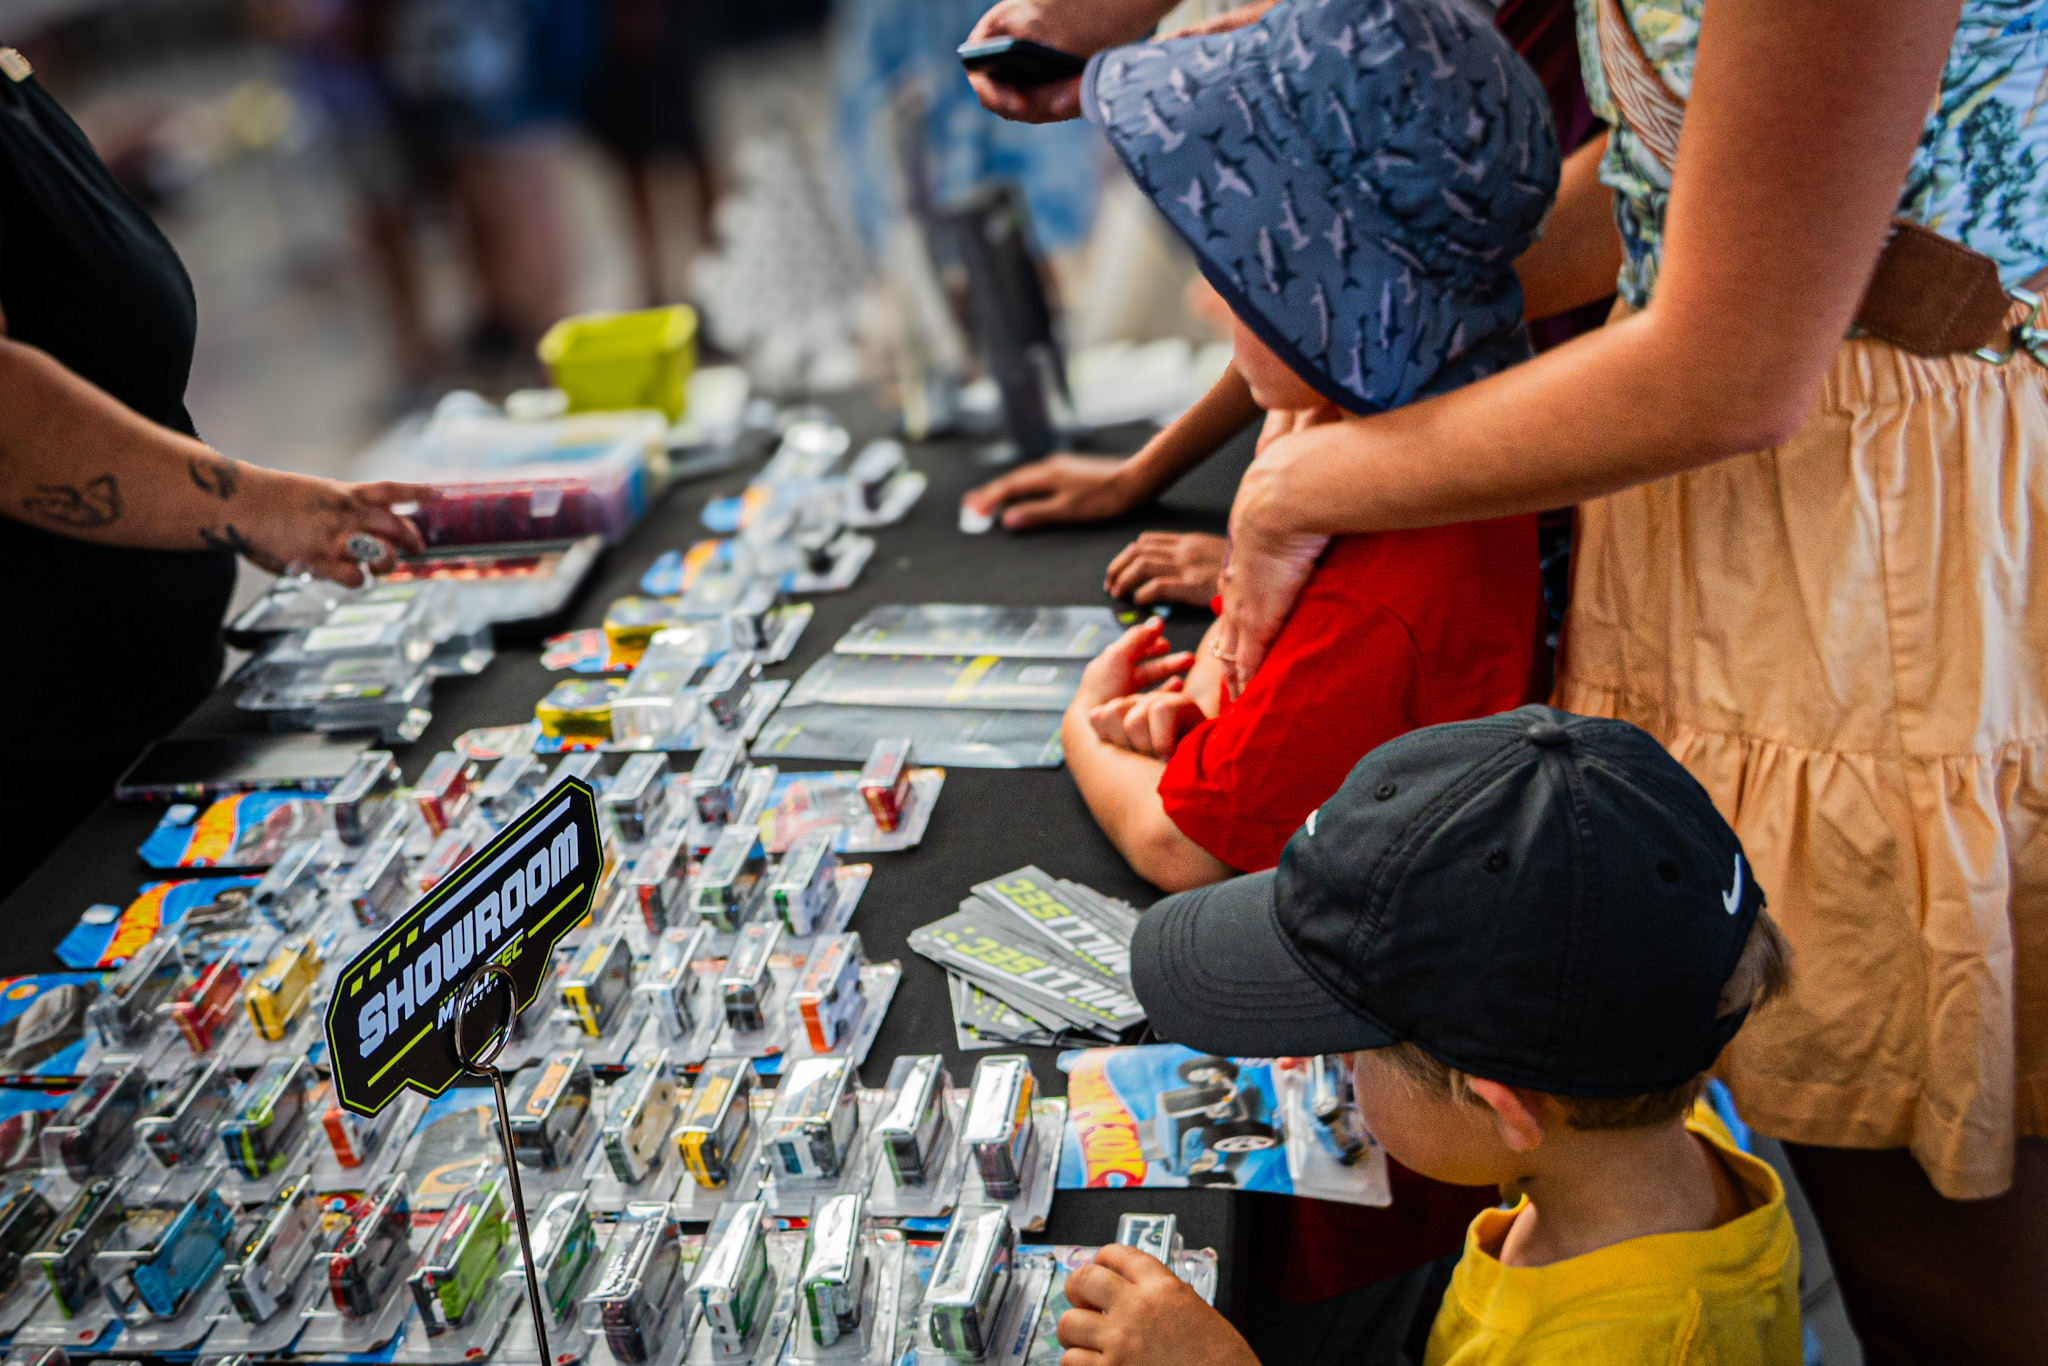
Students choosing a vehicle from the showroom wall
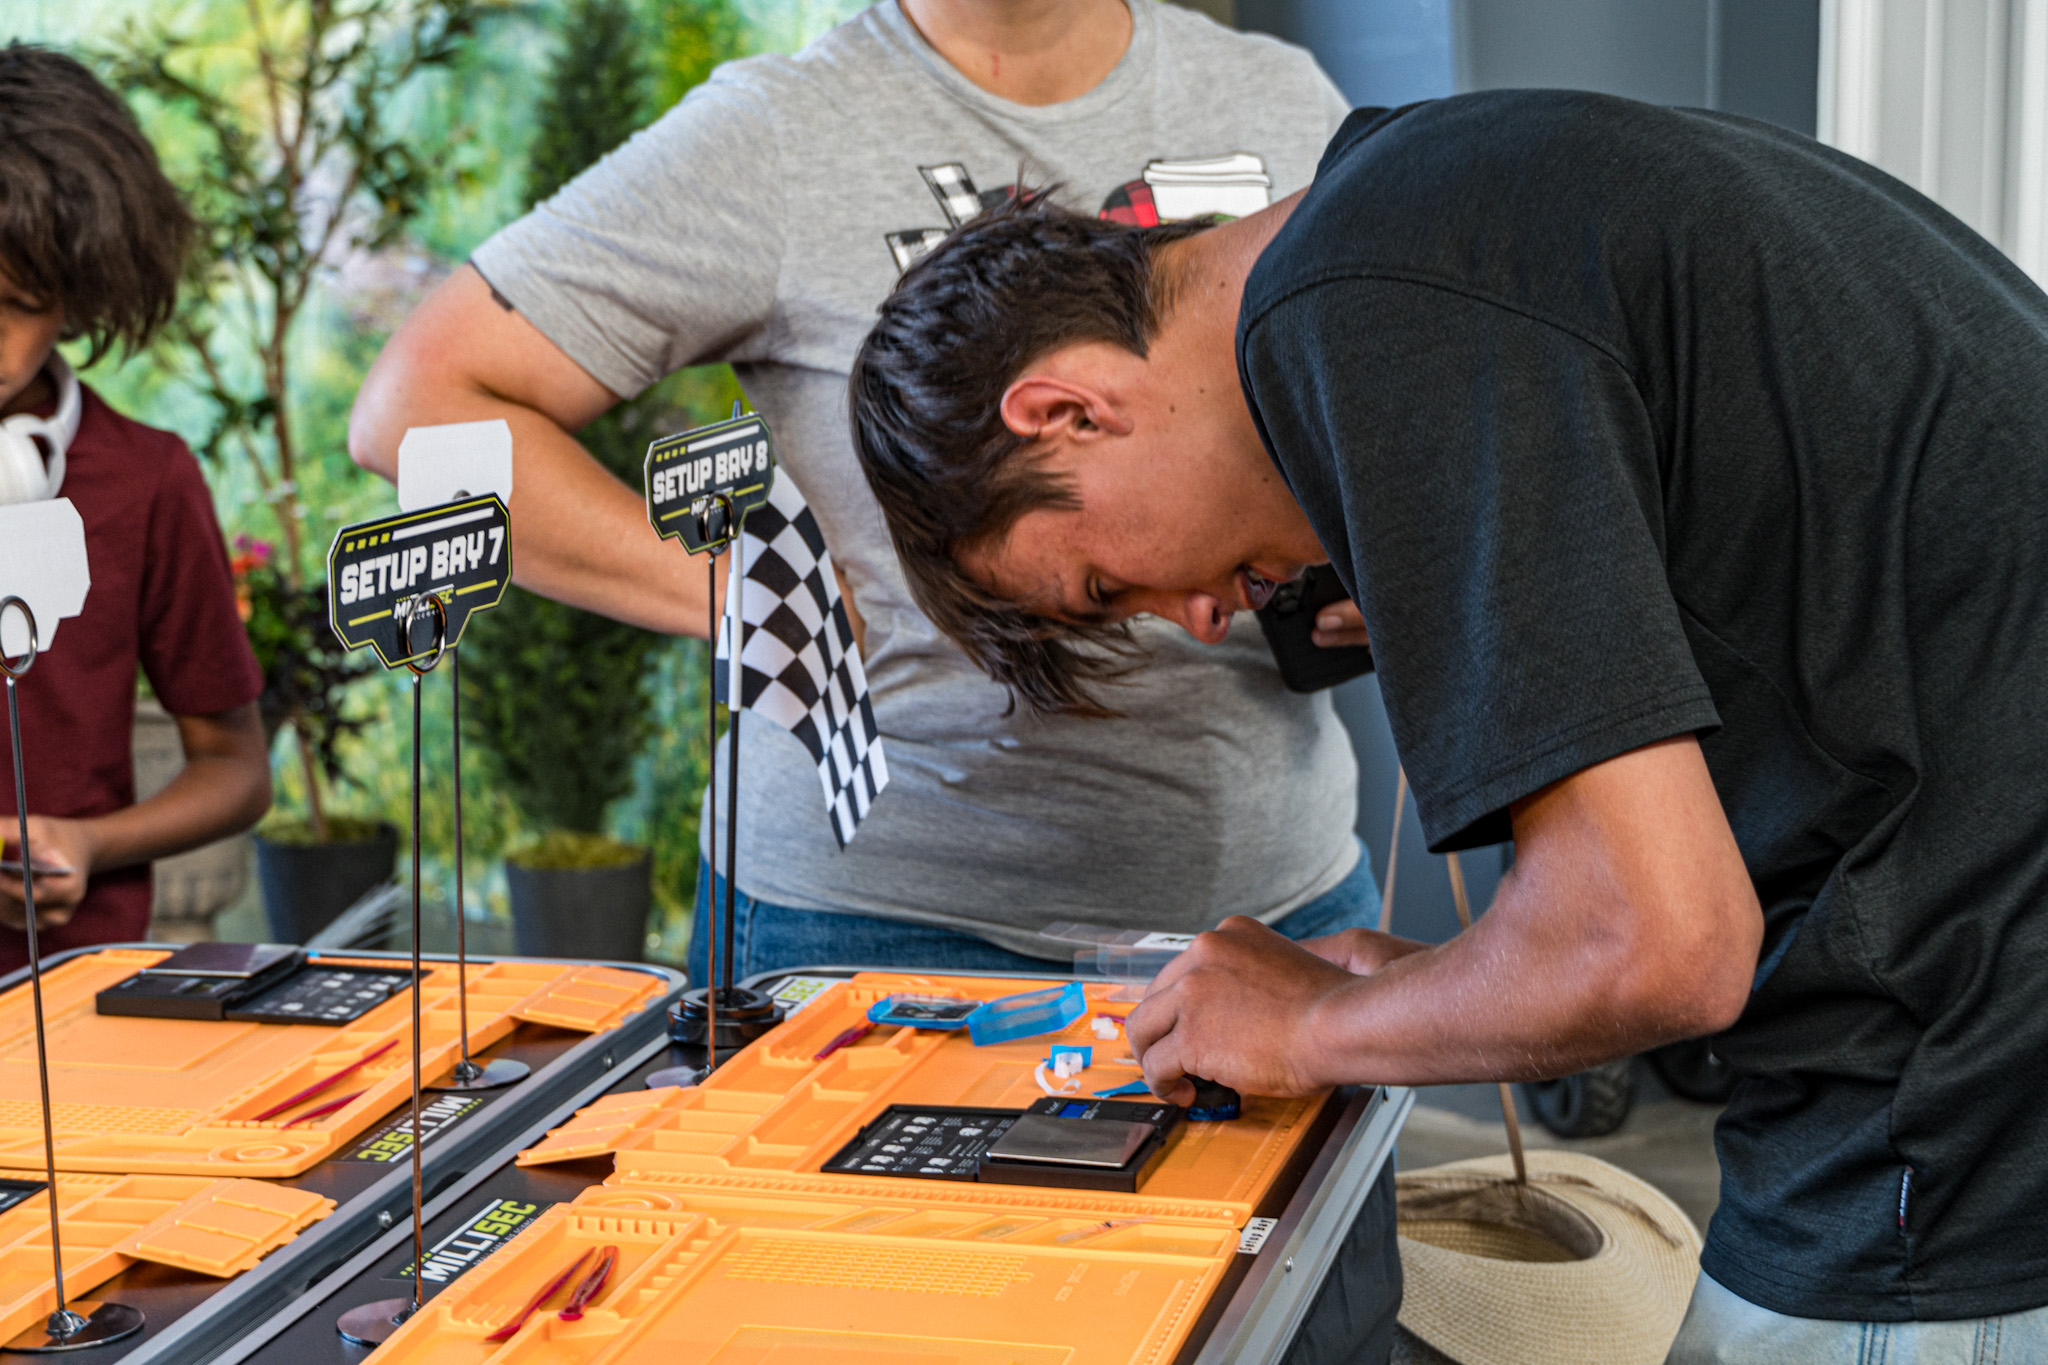
A student planning a change at a staffed bay
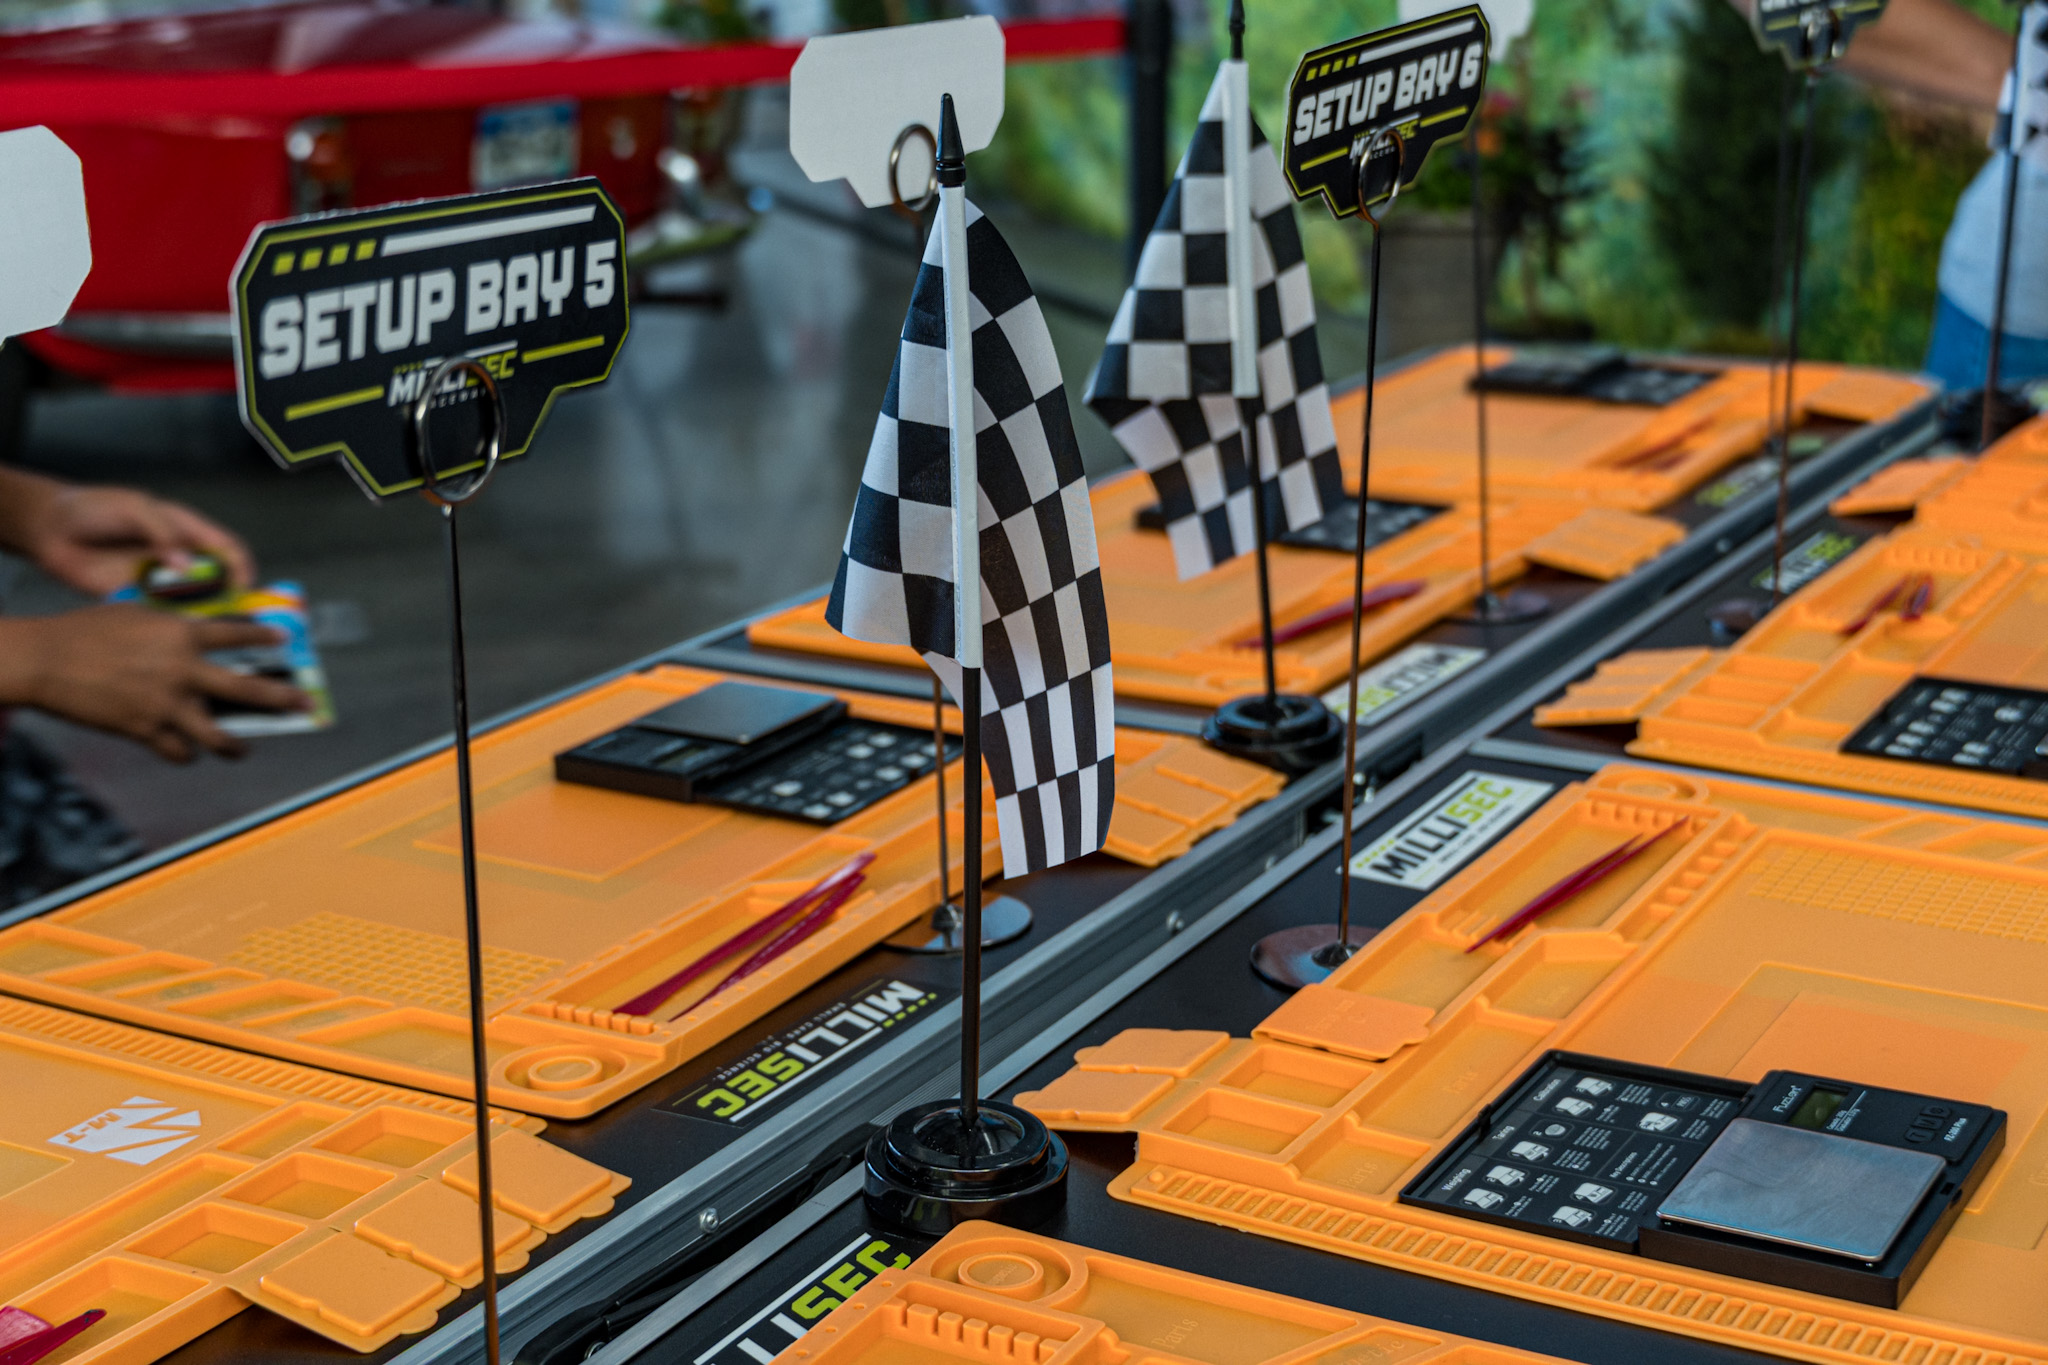
Tuning bays with tools, weights and digital scales
Place your vehicle on the scale
42.0g
WEIGHED AND LOGGED
last trial this vehicle: 44.6g
MilliOS chart plotting weight and speed against trial number

MilliOS runs the scale, the staging grid, the sensor timing and the boards on the wall.

Each lane is calibrated, so the first car across the line is not always the fastest on adjusted time. Students learn to trust the measurement over the eye, and to let the data decide.

Two programs

Same process. Middle school just brings more tools to the bench.

Both grade bands run the same investigation — baseline, one change, retest. Middle school simply has more of the shop open to it. Colorado adopted the NGSS as the Colorado Academic Standards for Science, with engineering embedded in the Science and Engineering Practices, and both programs are built against that structure.

Elementary students at the lanes
Elementary · Grades 3 to 5

Design it, tune it, beat your best

Students start by making the car their own — choosing it, decorating it, exploring the design before the engineering begins. Then peel-and-stick weights and a little aero shaping across about eight trials, each one measured against their own baseline. Measurement outranks intuition: a student certain that more mass means more speed watches the chart say otherwise, and the correction is theirs to make. Gains are percent off a baseline, so fraction and ratio reasoning end up on the gym floor.

Students design and decorate their own vehicle first — the creativity and the art, then the engineering
Peel-and-stick weights and light aero shaping across about eight trials
When a car runs faster backwards, they get to ask why — and test it
TopicGradeWhere it lives in the standards
Engineering design cycle3-5NGSS 3-5-ETS1; CAS Science and Engineering Practices
Forces and motion3NGSS 3-PS2; CAS Grade 3, Physical Science
Energy and energy transfer4NGSS 4-PS3; CAS Grade 4, Physical Science
A middle school student working a vehicle at the bays
Middle · Grades 6 to 8

Everything elementary does, plus the chop shop

The same process as elementary, with far more of the shop open. The chop shop comes into play: students call for the roof to come off, holes drilled in the base for ballast, heavier modifications that bring in real engineering spec. Our staff run the tools; the students make every call. And the discipline that makes it engineering — change one thing at a time, so the chart can say exactly which change earned the time.

The chop shop opens up: take off the roof, drill the base for ballast, reshape the body
Staff run the tools; the students make every engineering call
One change at a time, so the chart can prove what actually earned the time
TopicGradeWhere it lives in the standards
Engineering design cycle6-8NGSS MS-ETS1; CAS Science and Engineering Practices
Forces and interactions6-8NGSS MS-PS2; CAS Middle School, Physical Science
Energy6-8NGSS MS-PS3; CAS Middle School, Physical Science
Independent evidence

A USC Rossier cluster randomized trial with fourth graders produced a 0.41 standard deviation gain in science and math, with equal benefit across gender, English learner, and special education groups.

A gain of that size is large for a classroom intervention. It moves a student sitting at the middle of the class to roughly the top third.

Source: USC Rossier School of Education, Speedometry Evaluation: Final Technical Report (2016), rossier.usc.edu

Leaderboard · biggest gains
1
Devin O
2.902 → 2.741
-0.161s
5.5% faster
2
Priya N
2.910 → 2.815
-0.095s
3.3% faster
3
Andrew W
2.788 → 2.700
-0.088s
3.2% faster
4
Kayla T
2.845 → 2.772
-0.073s
2.6% faster

Ranked by improvement over a student's own baseline. First name and last initial on public displays.

Program delivery

We supply the laboratory. You supply the engineers and scientists.

Pace

About one class an hour — roughly 20 students, up to 40 sharing a build

Trials per student

8 to 10, with time to redesign between them

Equipment and staff

Track, tools, kits and staff provided

Data and charts

Printed or digital MilliOS charts

Safety

No motors or projectiles; COI on request

Student privacy

First name, last initial on displays

Are you a teacher? Tell us your grade level, headcount, and the week you have in mind.

Bulk kit pricing with a written quote per school. Statewide competition enrollment available on request. We respond within 24 hours.

SALES@DRS.EVENTS   |   720.600.2747   |   DRS.EVENTS/MILLISEC
Small cars. Big science.