A Complete Engineering Laboratory, Delivered to Your School
Hundreds of diecast vehicles, staffed tuning bays, and a six lane track timed to 0.001 seconds. Students set a baseline, modify their vehicle, and retest to beat it. Every student keeps the car they built.
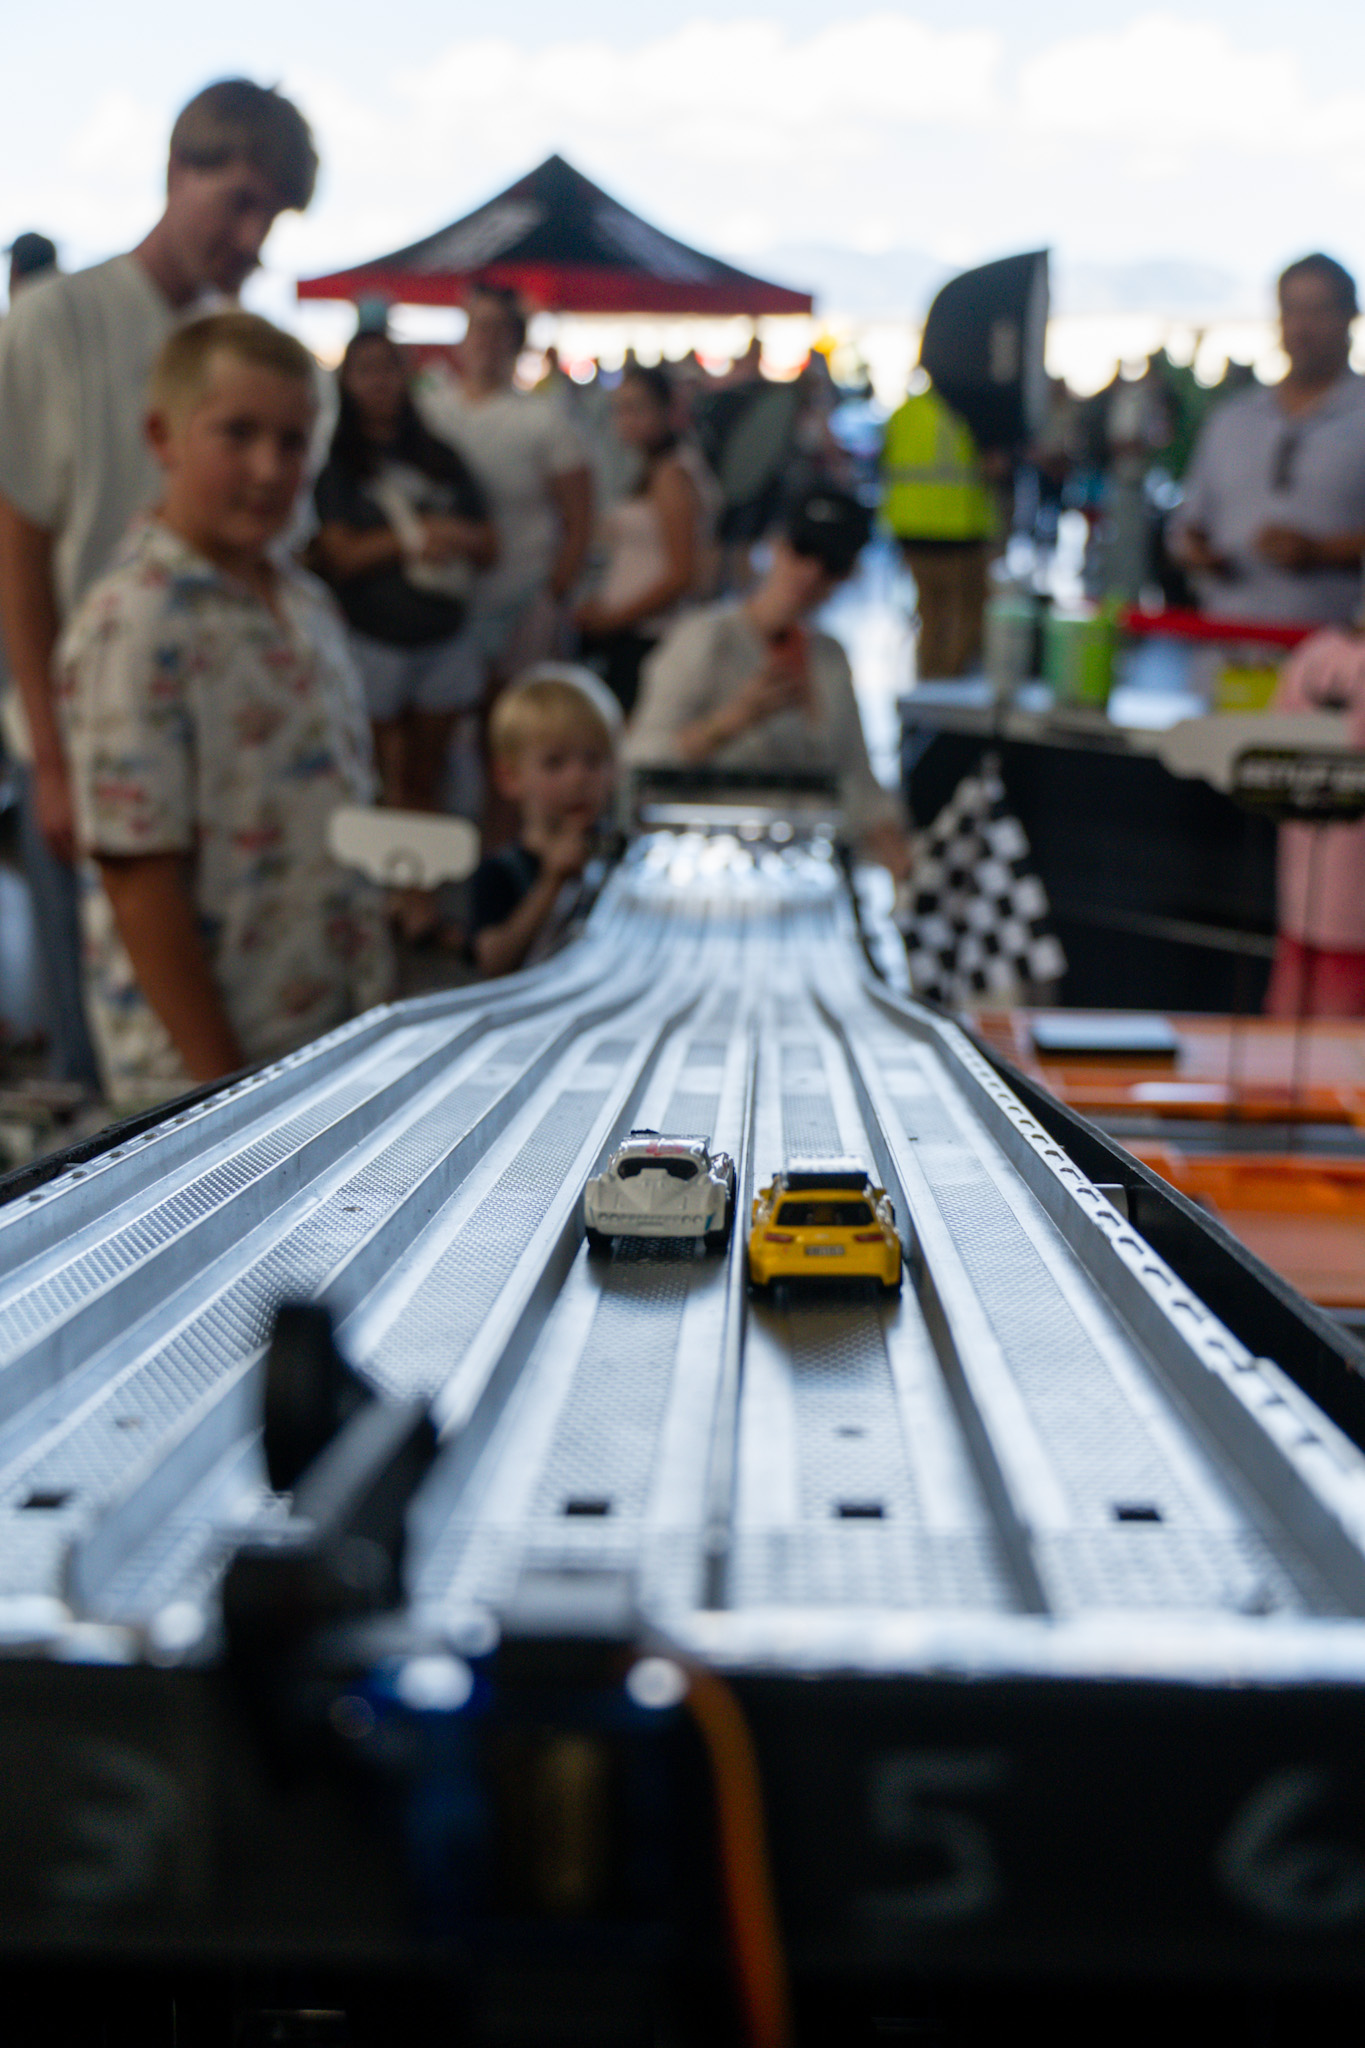
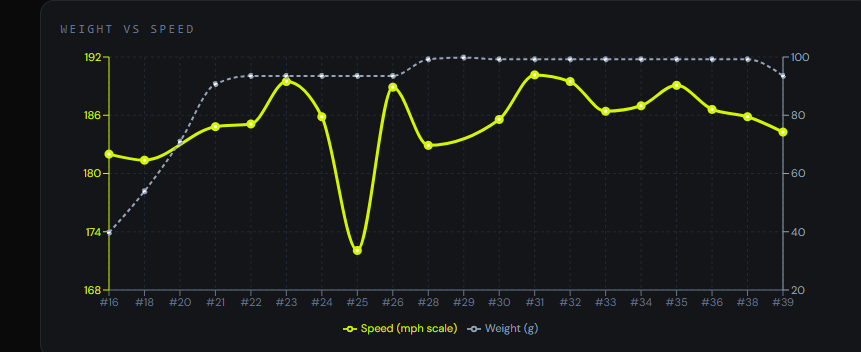
A fifth grader loaded her 1972 purple VW bus as heavy as the rules allowed for her ninth trial of the day. She felt certain the additional mass would carry her to a faster time. Eight trials of engineering had already cut fourteen percent off her 1.978 second baseline. This one came back ten percent slower than her best. She went backwards.
One trial left, and fifteen percent written on her card.
She is not nervous. Her chart shows every change she has made and what it did, and the correlation is clear: past a point, more mass stops buying speed. She returns to her work station and peels off two weights, four staying on, right where she wants them. The last percent has to come from the body, so the VW gets putty along the nose and a fresh dose of graphite on the axles before it is carried back to the scale for the last test.
All six lanes are occupied and the heat is locked. The lights count down and the cars release. It is all over in two seconds. Among the sounds of laughter and crashing vehicles at the bottom of the ramp, she stands in silence, watching for her number.
1.674 seconds. Fifteen point four percent. Her hypothesis is supported.
Each lane is calibrated, so the first car across the line is not always the fastest on adjusted time. Students learn to trust the measurement over the eye, and to let the data decide.
| Topic | Grade | Where it lives in the standards |
|---|---|---|
| Engineering design cycle | 3-5 | NGSS 3-5-ETS1; CAS Science and Engineering Practices |
| Forces and motion | 3 | NGSS 3-PS2; CAS Grade 3, Physical Science |
| Energy and energy transfer | 4 | NGSS 4-PS3; CAS Grade 4, Physical Science |
A USC Rossier cluster randomized trial with fourth graders produced a 0.41 standard deviation gain in science and math, with equal benefit across gender, English learner, and special education groups.
Source: USC Rossier School of Education, Speedometry Evaluation: Final Technical Report (2016), rossier.usc.edu
About one class an hour — roughly 20 students, up to 40 sharing a build
8 to 10, with time to redesign
Track, tools, kits and staff provided
Printed or digital MilliOS charts
No motors or projectiles; COI on request
First name, last initial on displays
Bulk kit pricing with a written quote per school. Statewide competition enrollment available on request.
Are you a teacher? Tell us your grade level, headcount, and the week you have in mind.